
Manage and Monitor Spring Boot projects in real-time.
Monitor application health, view real-time metrics, inspect environment properties, track HTTP traces, and manage log levels effortlessly—anytime, anywhere.
Engineered for clarity, crafted for developers
Everything you need to monitor health metrics, inspect runtime endpoints, and manage your Spring Boot services on the go.
Real-Time Health & Metrics
Gain instant visibility into heap memory, CPU usage, thread dumps, and system status right from your mobile dashboard.
Log Level Management
Dynamically view and update logging levels across TRACE, DEBUG, INFO, WARN, and ERROR in real-time without restarting your service.
Live Log Viewer
Stream and tail log files in real-time to inspect application outputs, stack traces, and runtime exceptions on the go.
Scheduled Tasks Monitor
Track and inspect all active cron jobs, fixed rate, fixed delay, and custom scheduled tasks running across your instances.
Endpoint Explorer
Native mobile interfaces tailored for inspectable actuator endpoints like /env, /configprops, /beans, /mappings, and /httptrace.
Secure Connections
Protect runtime environments with full support for standard security mechanisms including Basic Auth, OAuth2, and Bearer tokens.
Built for developers, optimized for quick diagnostics
Take a visual tour of the intuitive mobile interface designed specifically for clear actuator visualization, effortless navigation, and rapid incident response.
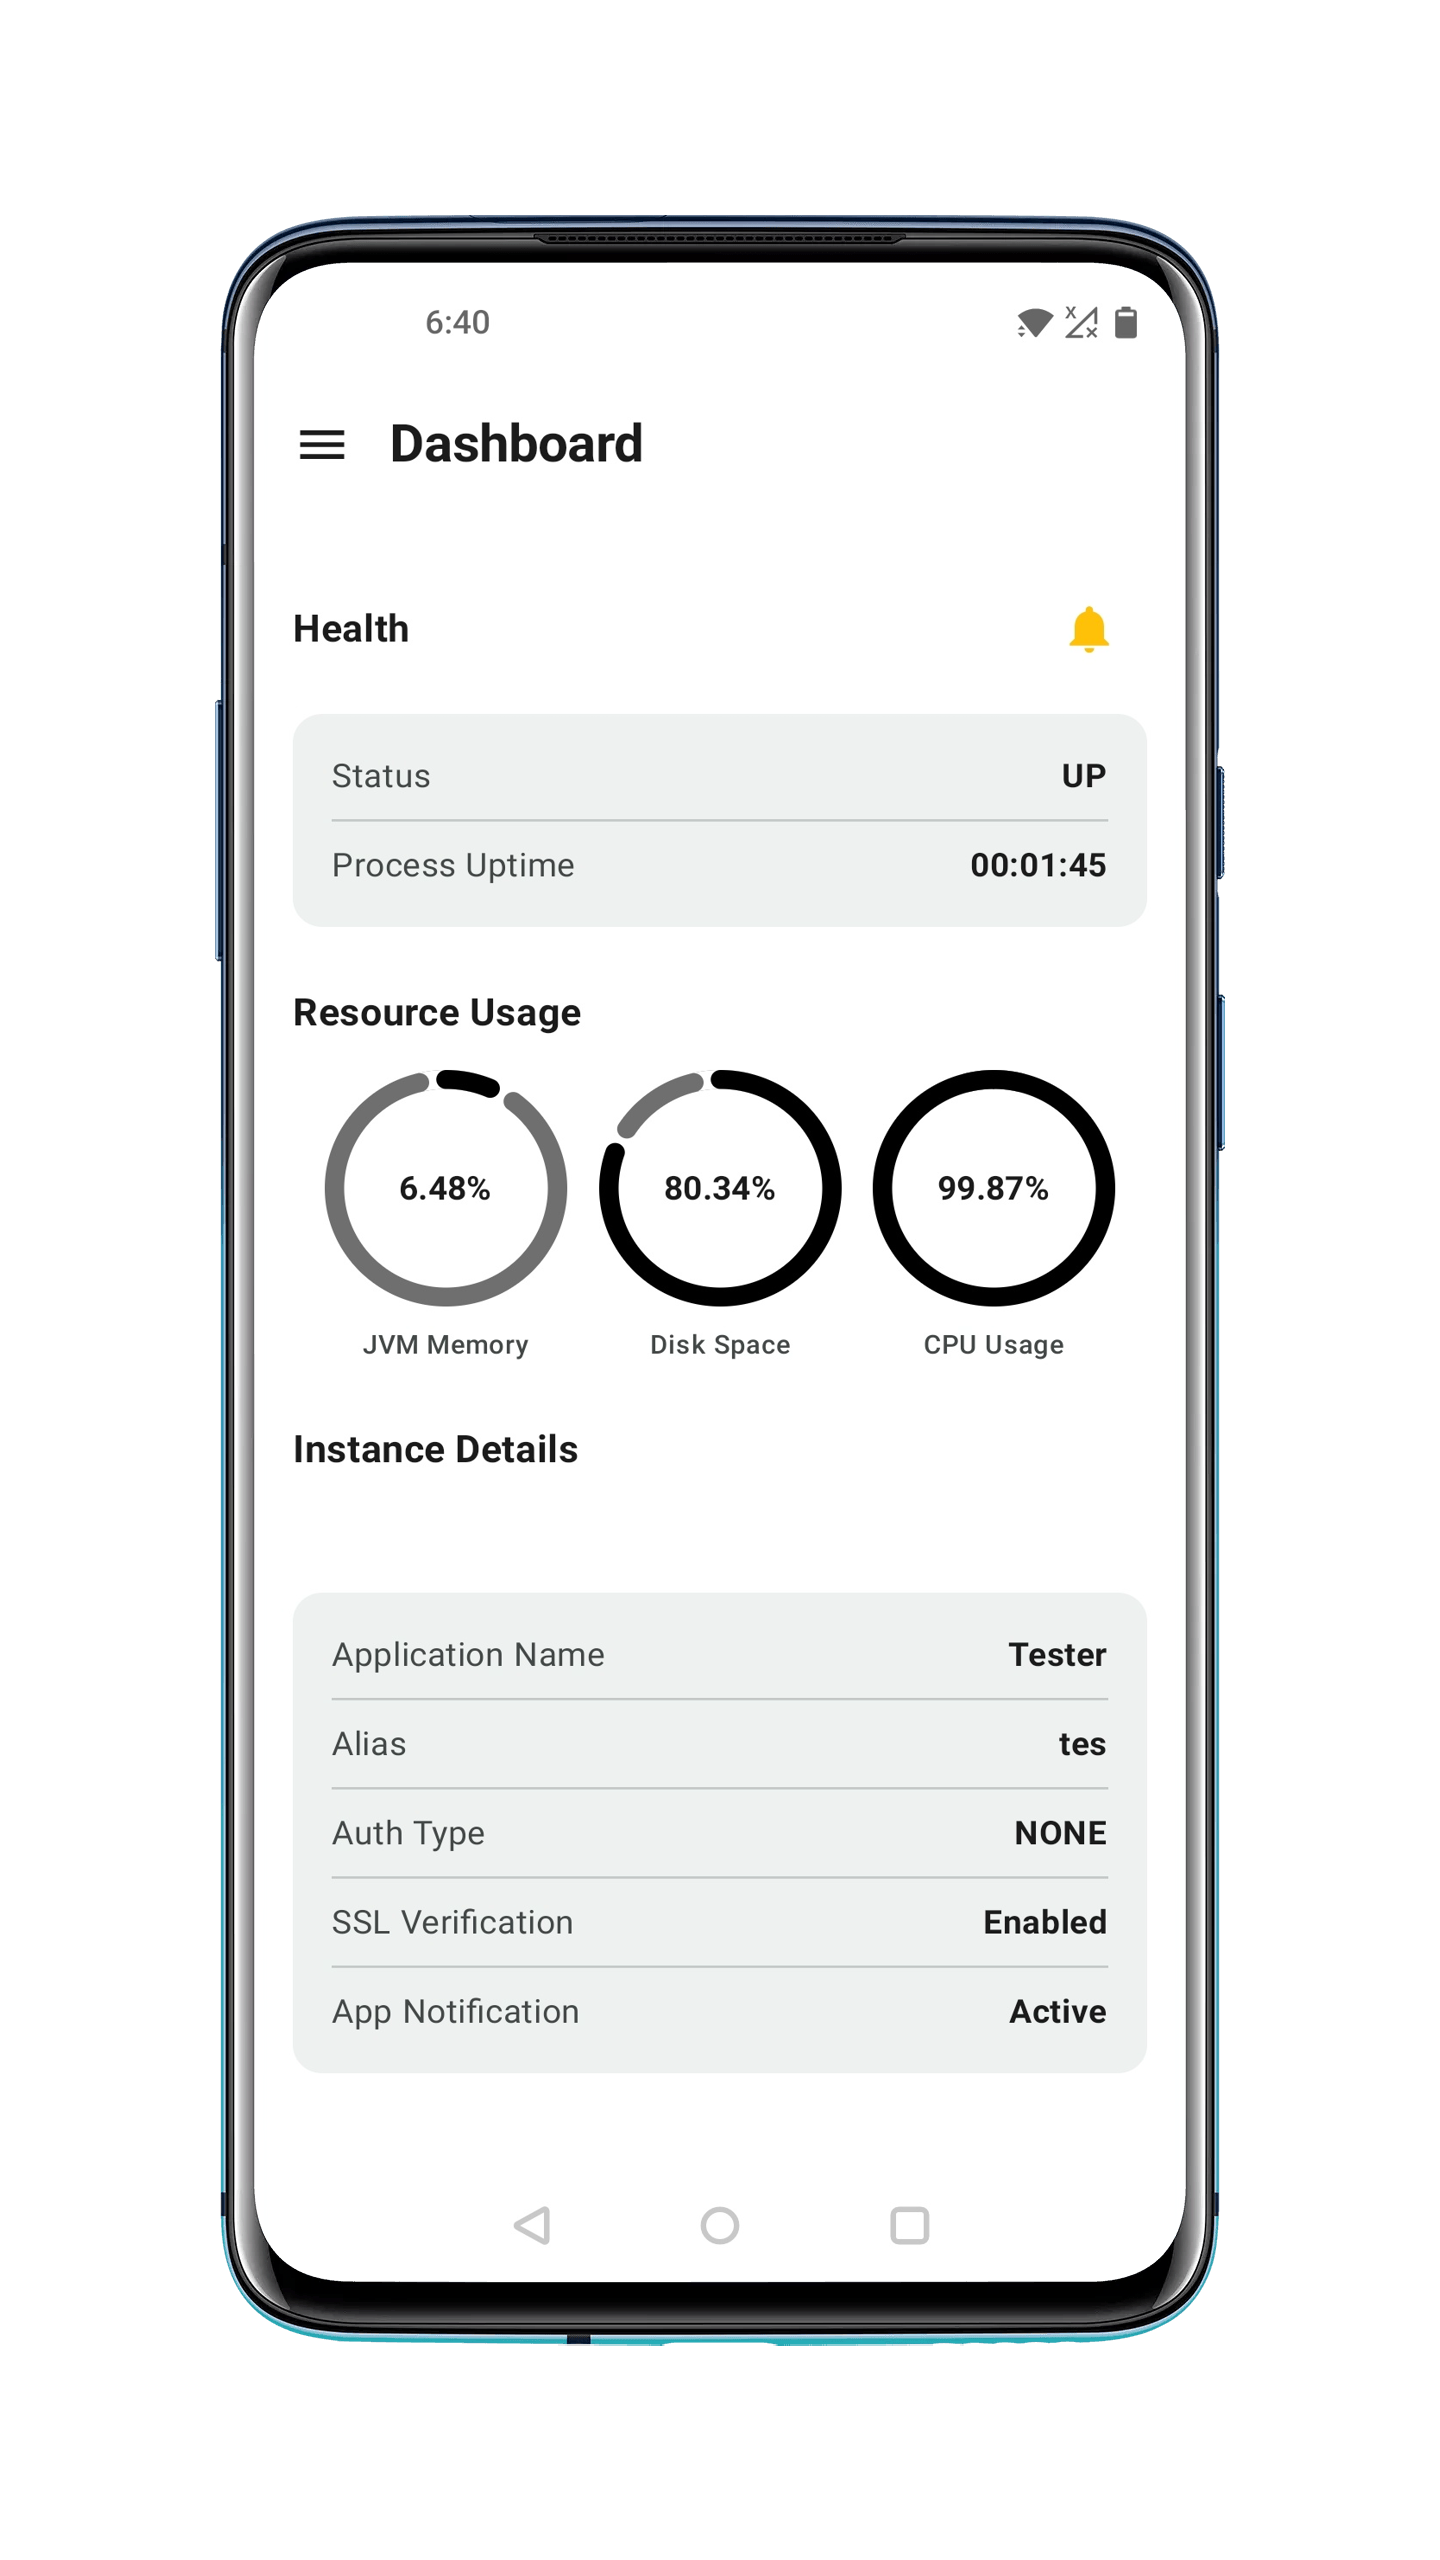
Dashboard & Insights
Monitor application health, uptime status, and critical Actuator indicators in one unified view.
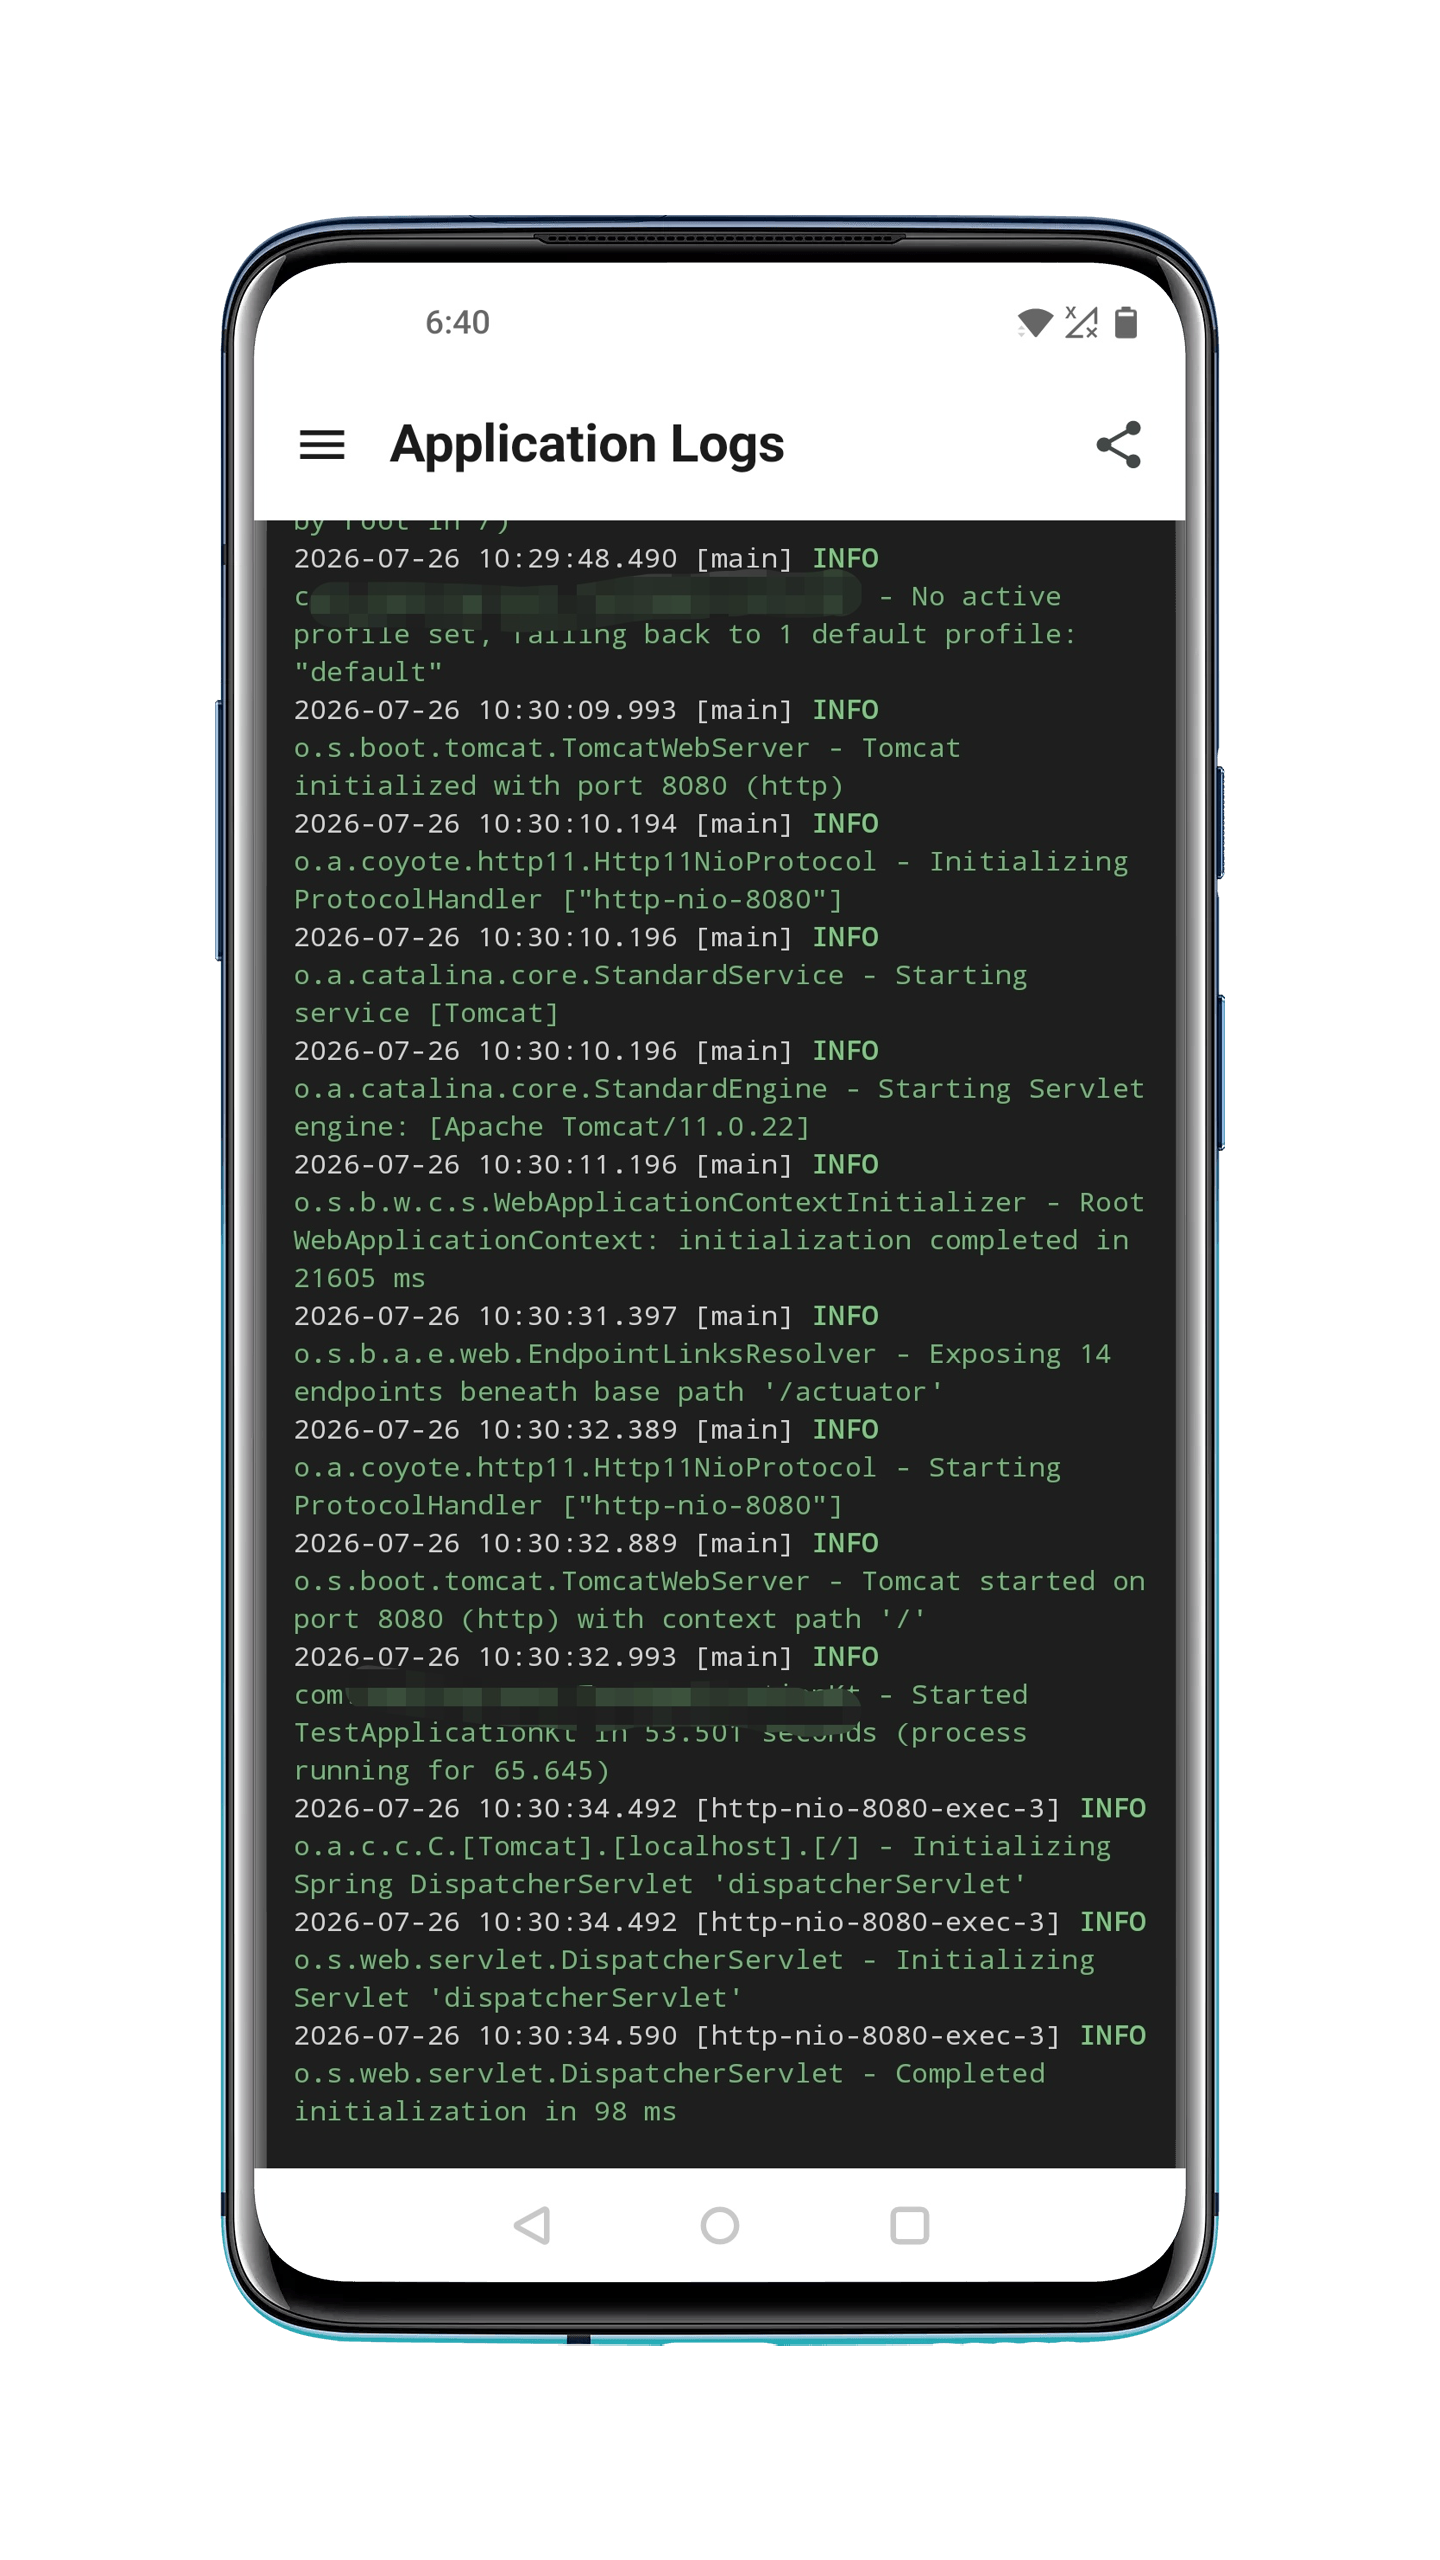
Live Log Viewer
Stream real-time log outputs, inspect stack traces, and adjust logging levels on the fly.
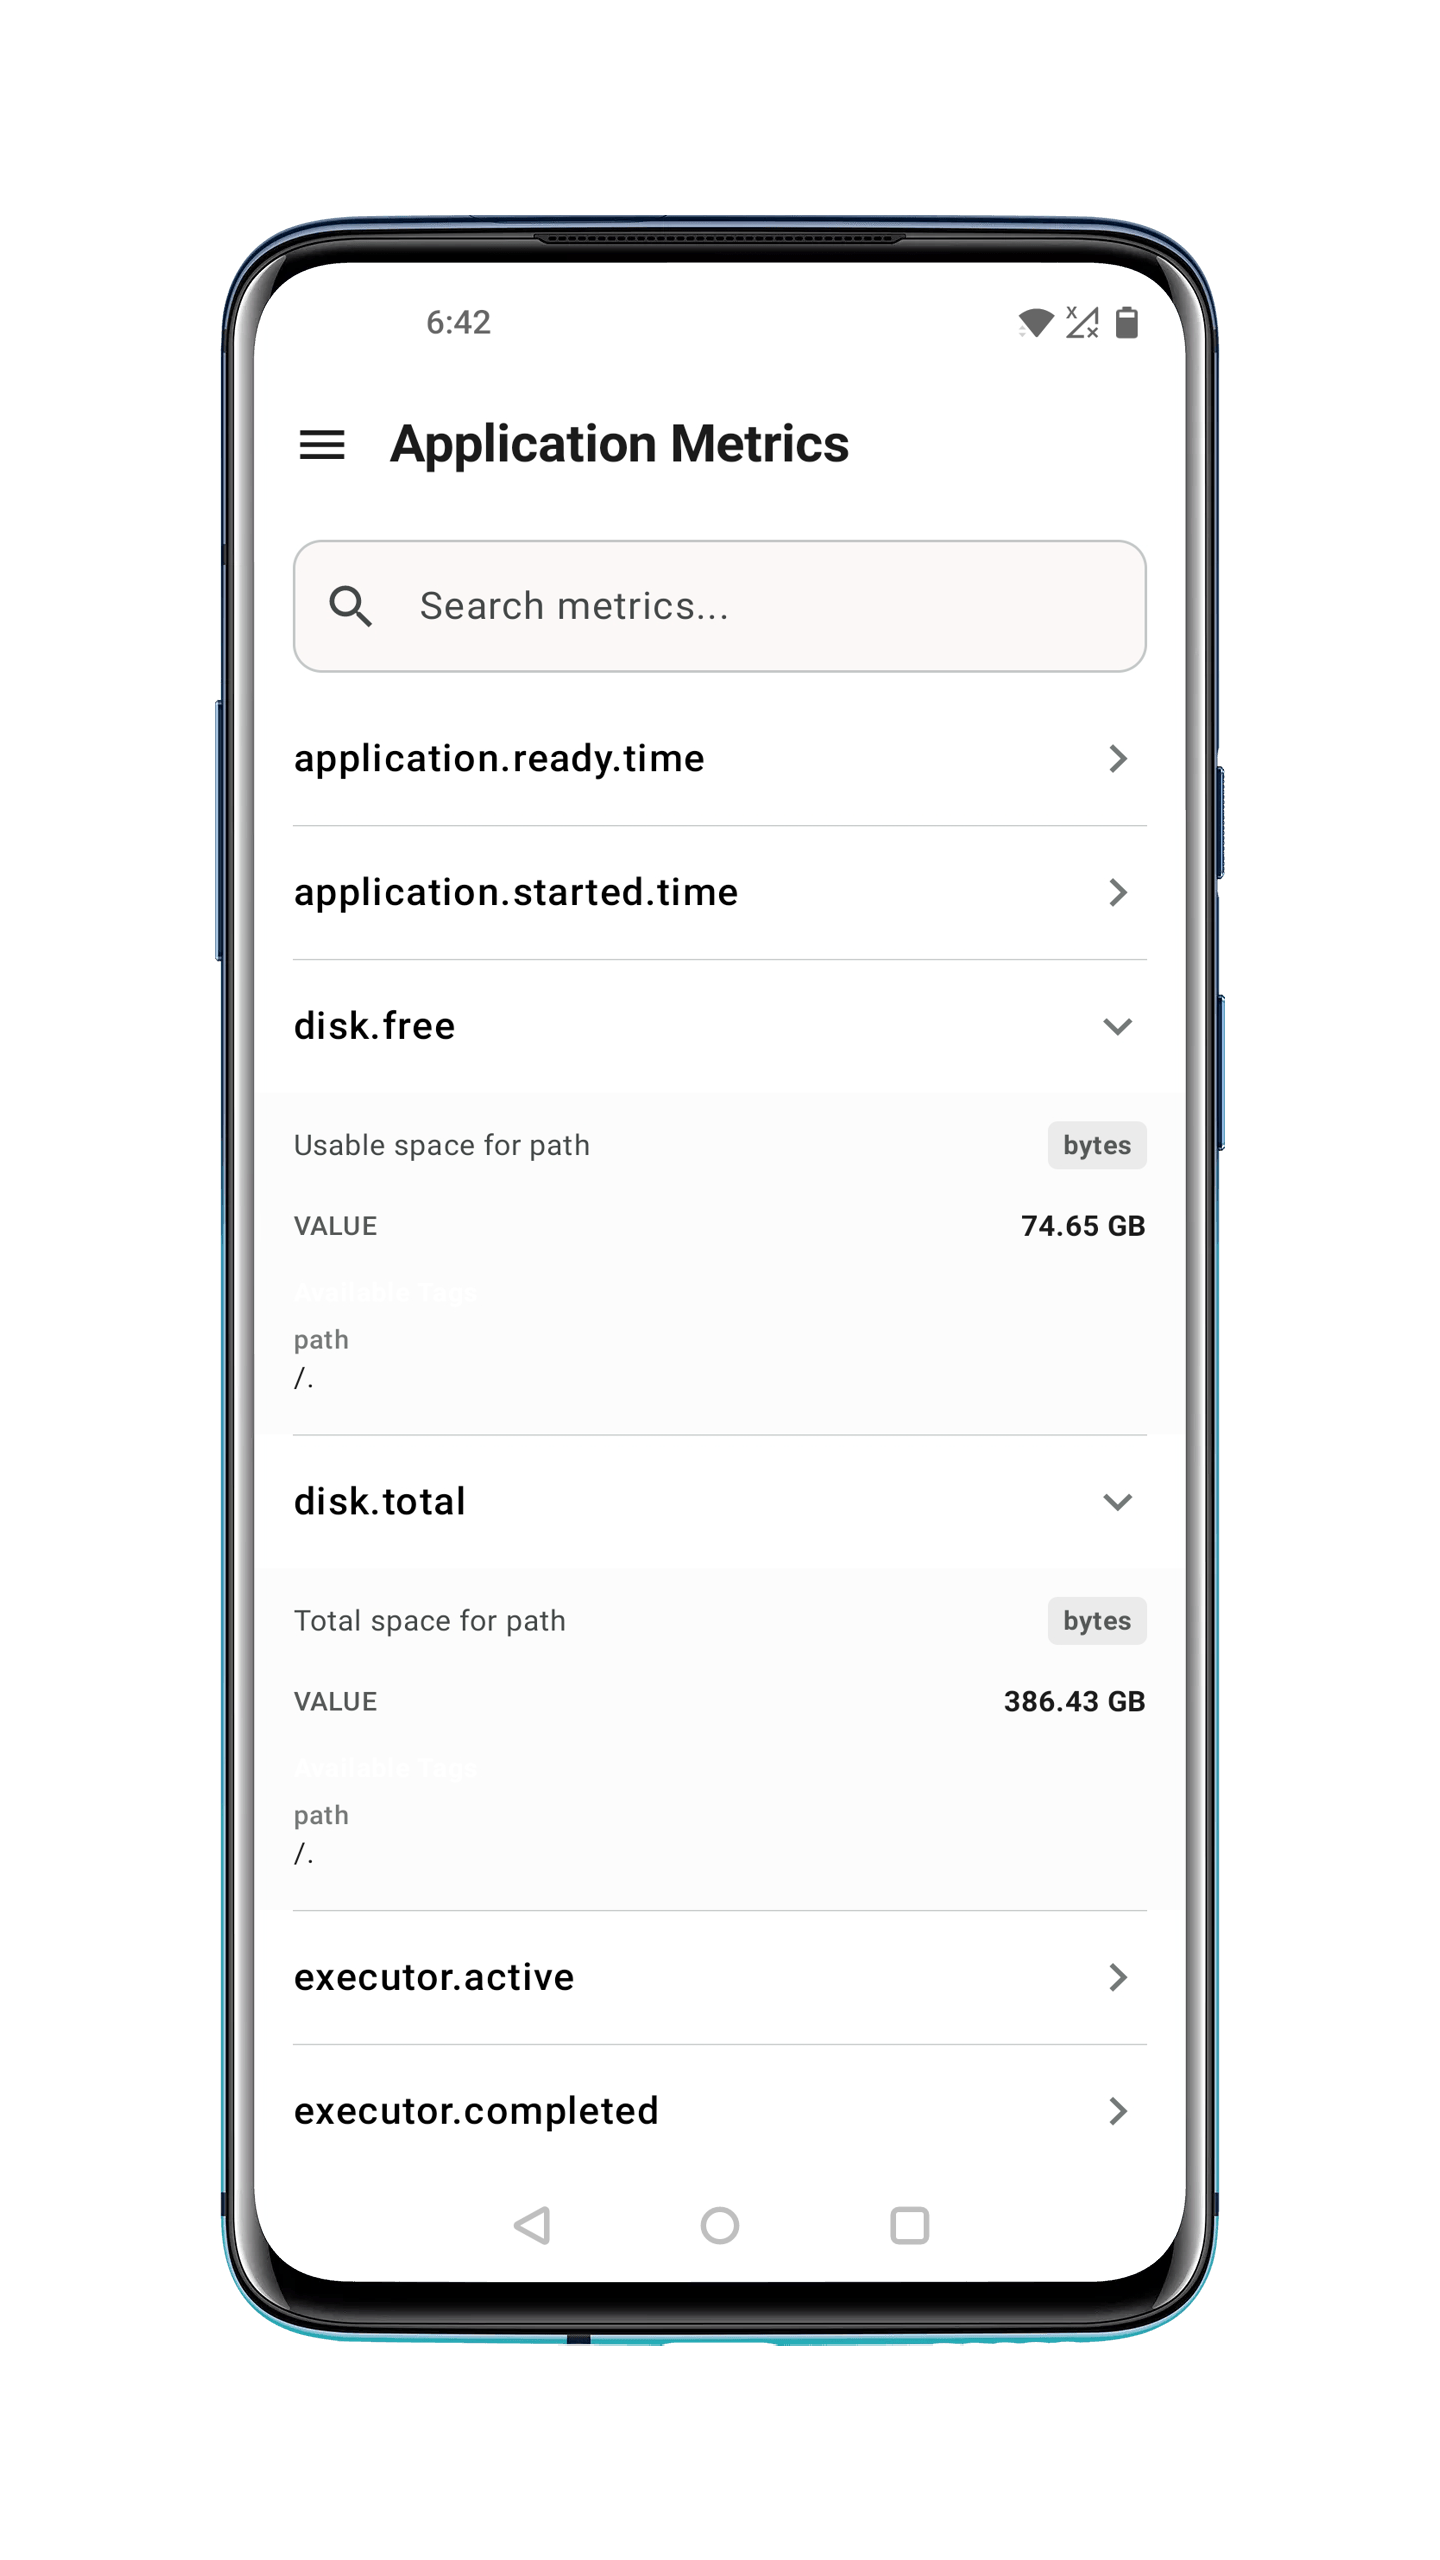
Application metrics
Track real-time JVM heap memory, CPU utilization, HTTP requests, and system performance.
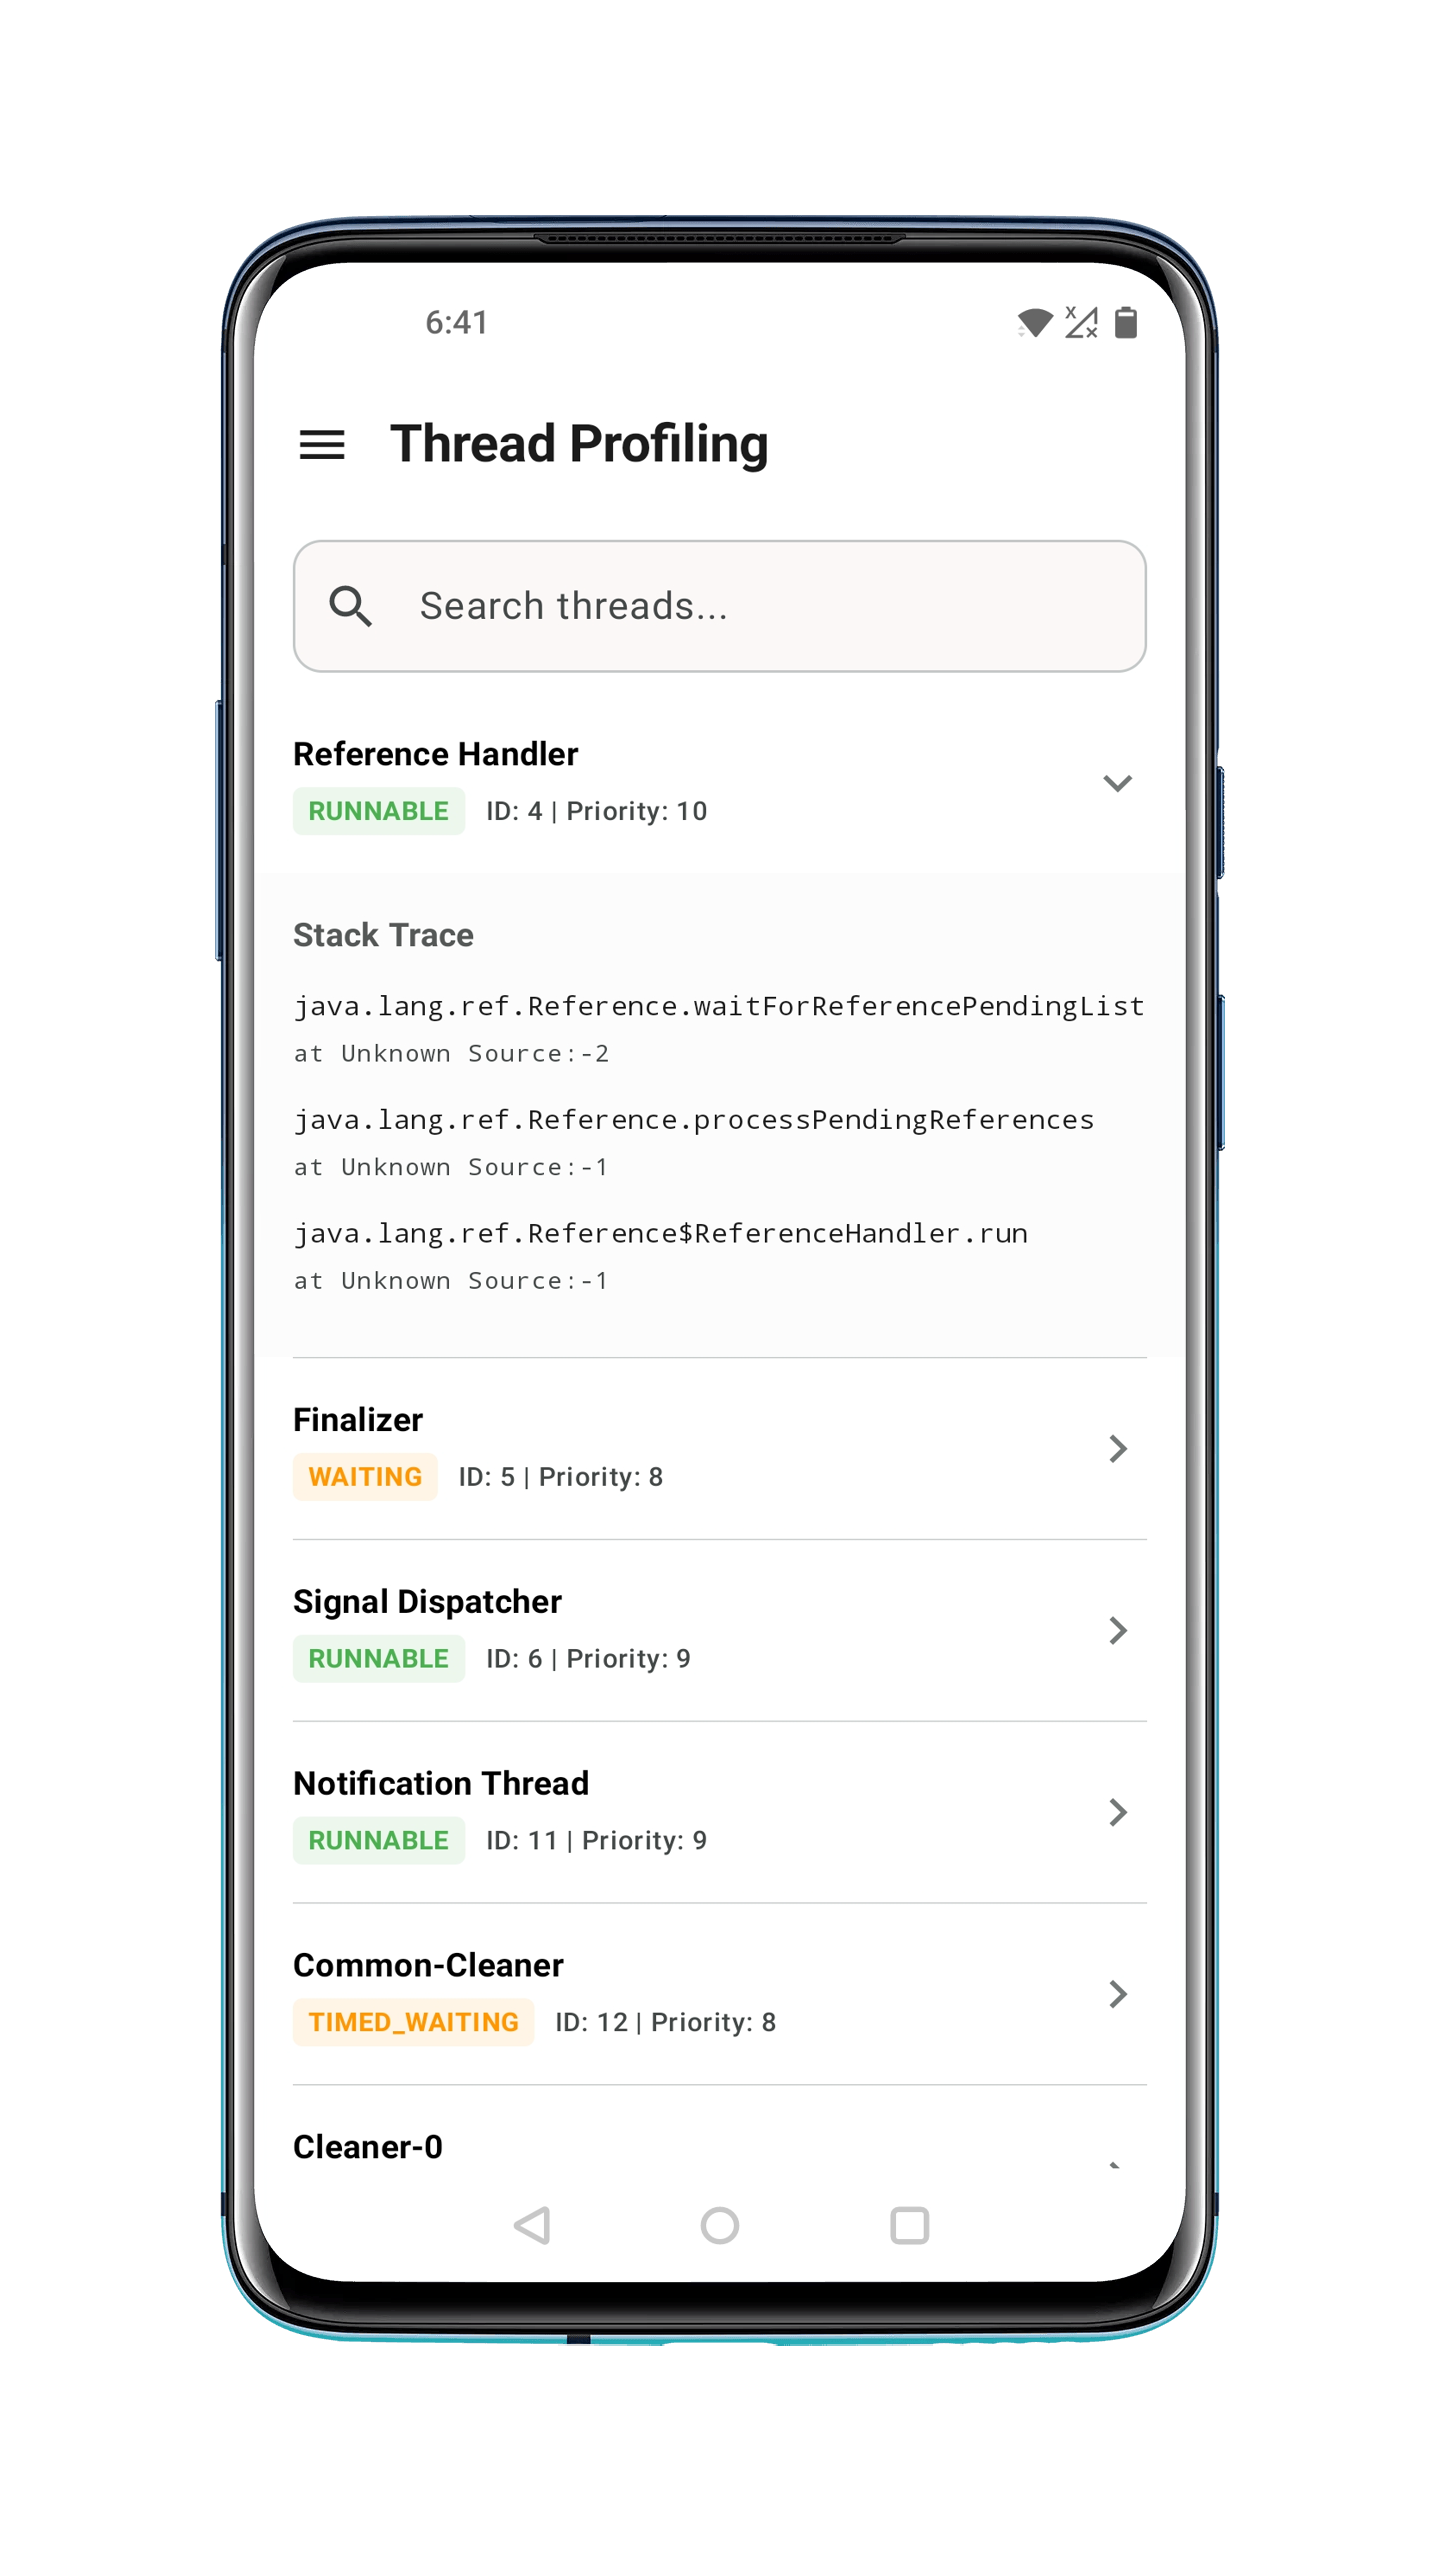
Thread profiling
Inspect active threads, analyze thread states, and diagnose performance bottlenecks effortlessly.
Frequently Asked Questions
Have questions? We have answers. Learn more about compatibility, sync, and security.
Ready to get started?
Download Actuator now from the Apple App Store or Google Play Store.